
Park City Bus Ridership Statistics
As long time readers know, I have been skeptical of Park City bus service providing a larger part of the solution to our traffic problems, than it does today. In its current form, I see how visitors may use the service but have a difficult time envisioning locals utilizing it more.
I had heard through the grapevine that my conjecture was off base; that the bus service was exceeding expectations. I was told that it was doing so well that additional bus service was being considered.
I’ll be the first to admit that actual statistics usually trump gut feelings. So, a few weeks ago I reached out to Summit County for statistics on the number of riders using bus service. I wanted to see if actual data backed up my anecdotal theories. I’ll save any commentary until I have a chance to sit down with Summit County Regional Transportation Planning Director Caroline Ferris and discuss the trends they are seeing.
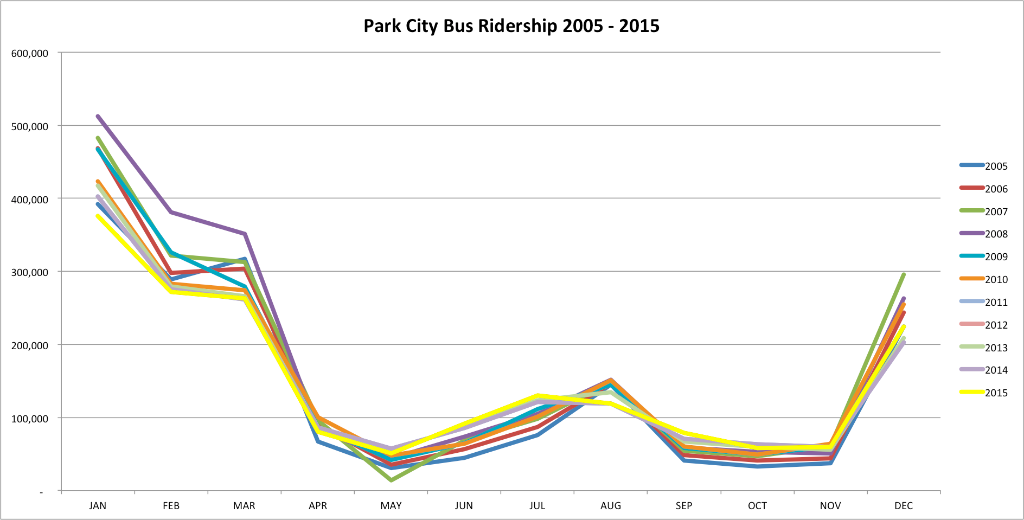
However, I did want to present the data. Below is a graph of bus ridership from 2015 to present (2015 is in bright yellow and you can click the graph for larger version)). If you are interested, you can also the detailed data that shows ridership by general route.
If you have any questions you’d like me to ask Summit County (given this data), please email me at
 .
.
Parkrag
We believe in citizen journalism. We believe there are stories to tell that can help to shape our community for the better. We believe tomorrow's Park City can be better than today's.
Comments
Leave a Comment